
 Free Screen Recorder for Chrome


Video Analytics Tools are important for businesses that want to know how their videos are performing online. Read the article to Boost Engagement & go Viral.
Stepping into 2020 feels amazing! Technology is rising at a pace that hasn't been ever experienced before. Brands around the world are acting highly competitive to grab the biggest chunk of it. From entrepreneurs to marketers, to sales professionals, every one has understood that if they want to stay and excel in their fields, they cannot do it without being a tech-junkie
We are living in a world that runs on artificial intelligence, machine learning and automation. If you or your company misses out on any of these, you might crumple and fall behind in this race to be the best.
Today, you can easily find companies selling mind blowing software that helps their consumers automate a certain function of their business and achieve a good degree of growth & customer success. But, in my observation, what is most of the Brands are missing out on is the Analytics- the game of numbers.
Every idea looks great in theory. But what differentiates a good idea from a great one is its execution.
And numbers (sweet stats) are your ultimate way of knowing how your business is performing worldwide, the loopholes that need fixing and what does the future hold for you. Now, I am not saying that companies or individuals in power of taking and influencing managerial decisions aren't aware of this number game, yet, for some unknown reason, people run away from perfecting analytics.
StoryXpress Video Analytics Tool

If you could get yourself a platform that makes reading analytics not just simple but pretty detailed as well, you can easily see the numbers materializing in front of you.
Now, as you know, the StoryXpress platform lets you create engaging videos for your products, customers and prospects, and share them on the internet with a link.
But have you ever wondered what happens to all those video that you created so meticulously after you have shared them around?
That is where the StoryXpress steps up and provide you with detailed analytics that explain how engaging your campaigns had been, which parts in a video have been repeatedly watched and which parts were ignored completely.
By observing the small and big details, you can easily figure out which part in the video are working and which aren't. You can accordingly revamp your strategy and make changes in the video.

The NEW YEAR GOALS to Lift your Brand
If you are strategizing your new year or quarterly goals, this is the best time to invest in analytics and learn where you are lagging on and what you can do to screw the bolts.
I am a big fan of the StoryXpress video analytics tool, because you can observe the following using it:
- How many viewers are your video getting. (including unique views)
- Which parts of a video are being watched repeatedly.
- Engagement per second throughout a video.
- Add a CTA to your video and see how many times the link has been opened. (Click through rate)
- Capture emails or any other important information through the form.
- Average watchtime for each video.
- Engagement peaks & drops in a video, to understand which frames are performing great and which ones need improvement.
- Information about Viewers' Browsers and Operating Systems.
The StoryXpress platform gives you multiple ways to figure out the areas they need to put more focus on. Here is a detailed view into the StoryXpress Video Analytics tool so that you can see how it is done and how you can use these elements to give your company a forward push.
Let me give you a walk through of the analytics
This new year we created a company video on the StoryXpress platform. You can first watch the video and then read the analytics to see how the StoryXpress analytics give you a detailed overview into every little thing that can help you make your business better.
Now that you have seen the video, let us look into its analytics to see how you can figure out how you can improve engagement.
Individual Video Analytics
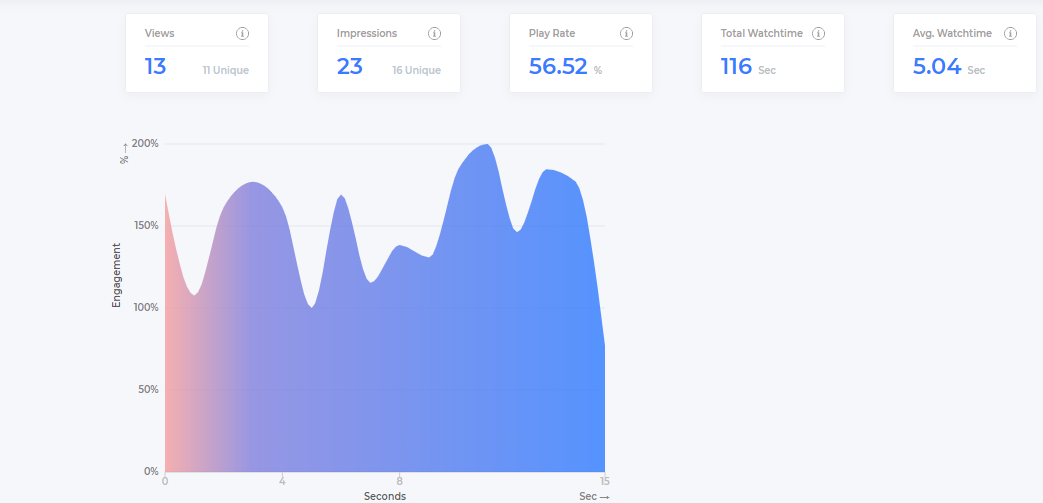
Individual Video Analytics on the dashboard explains
- Views- Views is the total number of times a video has been watched. If you will notice carefully you will see the number of unique viewers as well. In this case it is 34.
- Impressions- Impressions is the number if times a video has been viewed, or displayed on a webpage.
- Play Rate- Play rate is the ratio of the number of times a video has been played and the total number of impressions it has received.
- Total Watch time- Total watch time is the total duration for which a video has been watched.
- Average Watchtime- Average Watchtime is the average duration for which a video is watched, per view.
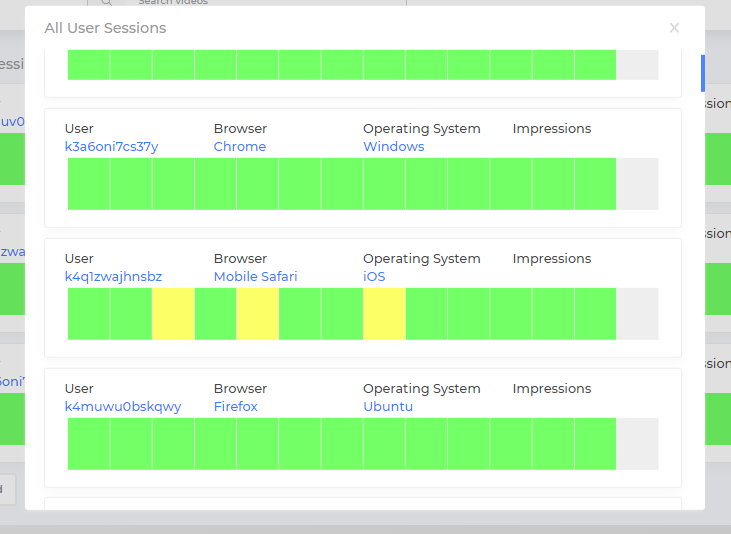
Heatmaps
Heatmaps are a pretty way to observe the overall response to a video, and judge which parts in a video did amazingly well and which parts weren't engaging enough to push the viewer to watch again.
But before I talk about the heatmaps, observe the All User Session. Here in the All User Session, you can find information about the Browser and operating system of the viewer.
Now lets understand the colors. The green color depicts that those portions in a given video has been watched only once. The yellow part demonstrates those portions have been watched twice. Whereas, the red portion, which unfortunately isn't present in this particular piece of analytics, demonstrates that those portions have been watched multiple times.
Wrapping up
Video creation is incomplete without a complete platform that offers you wide-range of options to host as well as analyze the performance of your videos. With StoryXpress, a full-stack video marketing platform, you can create videos, host videos, share videos and analyze Video-engagement. All in one place! One platform to fulfill all your video needs.
If you want to know more about StoryXpress Analytics and hosting platform, checkout "StoryXpress' Hosting & Analytics Platform"