The individual video analytics shows you the detailed video performance.
To view analytics of an individual video you can refer to the below steps:
1. Go to dashboard.
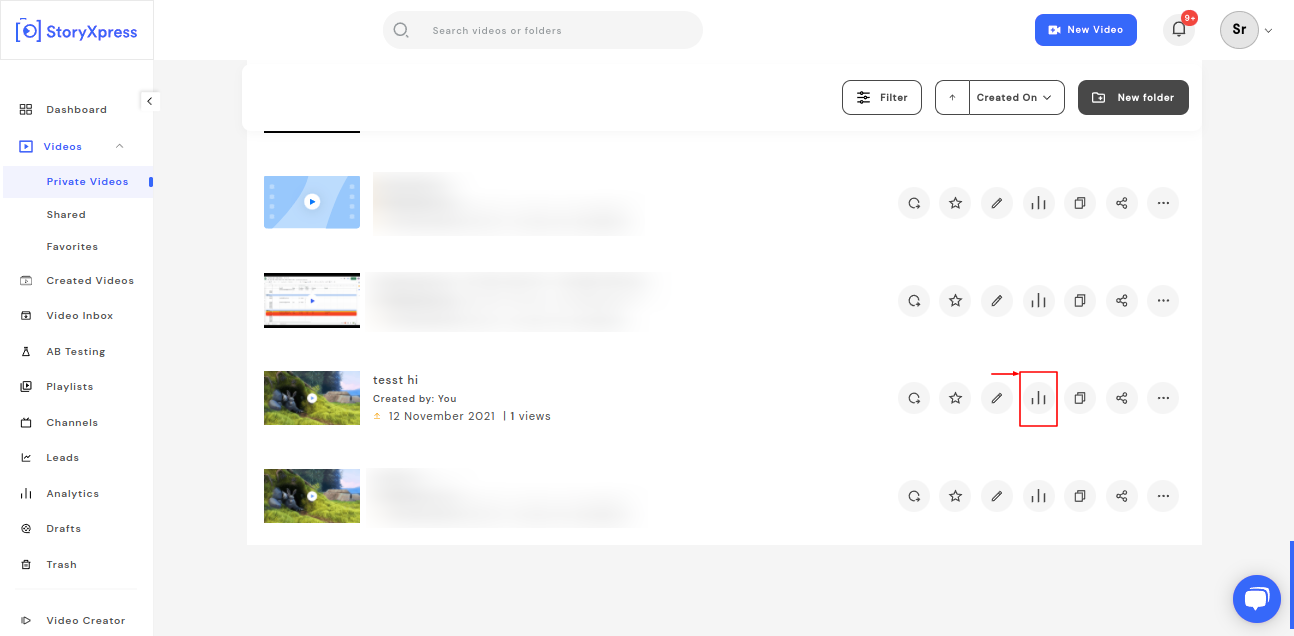
2. Go to the Videos option and select the video for which you want to view the analytics.
3. Select the analytics option on the right side of the thumbnail.

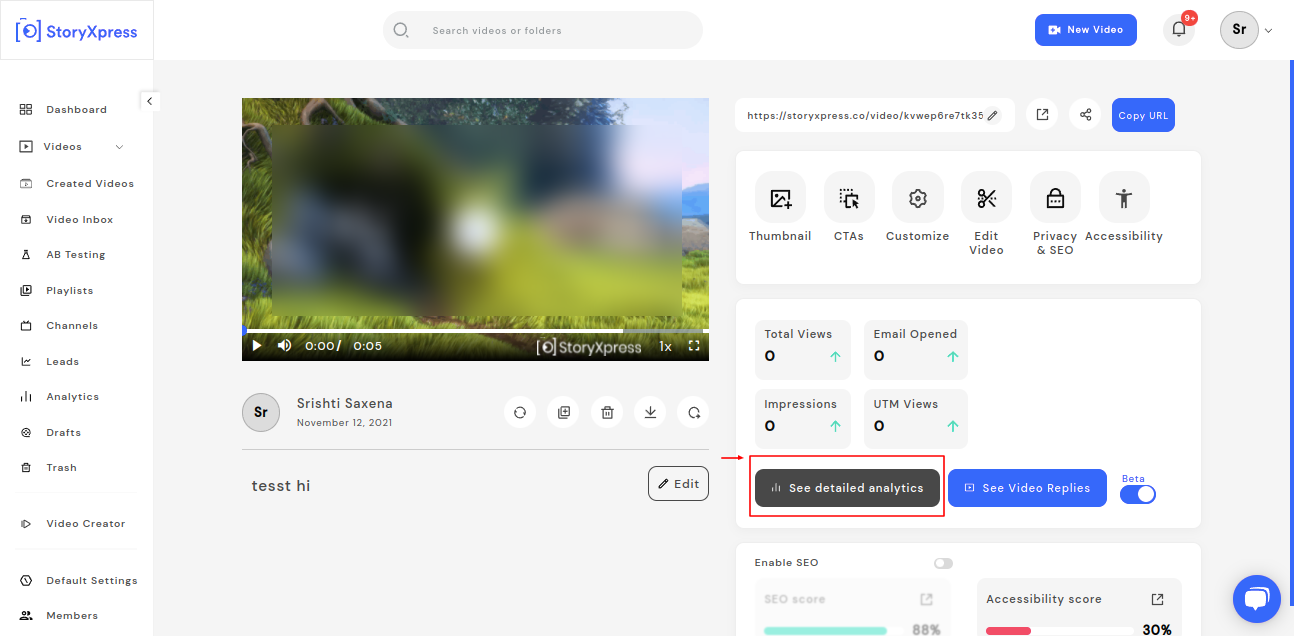
Or you can open the video and click on ‘See Detailed Analytics’.

4. This segment is further divided into 3 parts:
- StoryXpress Analytics
- Social Analytics
- Email Analytics
STORYXPRESS ANALYTICS
Views: Views are the total number of times a video has been watched. If you will notice carefully you will see the number of unique viewers as well.
Impressions: Impressions are the number of times a video has been viewed or displayed on a webpage.
Play Rate: Play rate is the ratio of the number of times a video has been played and the total number of impressions it has received.
Total watch time: Total watch time is the total duration for which a video has been watched.
Average watch time: Average Watch time is the average duration for which a video is watched, per view.
Engagement graph: It shows viewers’ consolidated engagement percentage every second, throughout the video.

Overlay Response: It shows the responses received to the form added in the video. You can also download the response in a .csv file.

UTM Source views: Ratio of views you are getting from different platforms where you have shared the links.
UTM Source Impressions: Ratio of number of times viewers have visited your video page from the shared different platforms.
Traffic Sources- Browsers: Gives you the list of various browsers on which your video is being viewed and data is stored along with the impression.
Traffic Sources- Operating System: Gives you the list of various Operating systems on which your video is being viewed and data is stored along with the impression.

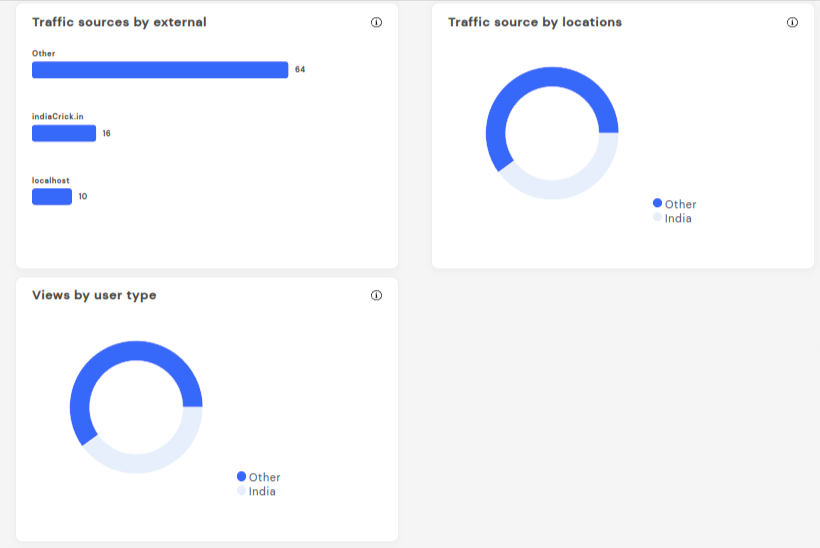
Traffic Sources- External: Gives you the list of website sources from where the user landed to your video and data is stored along with the impression.

SOCIAL ANALYTICS
EMAIL ANALYTICS
Total email sent: Gives you the number of emails shared.
Total emails opened: Gives you the number of users that opened your email.
Total email clicked: Gives you the number of users that clicked your email


 Free Screen Recorder for Chrome


