The consolidated Analytics depicts the detailed performance history of your videos in terms of views, average watch-time, top videos, and traffic source locations.
To access analytics please refer to the below steps:
1. Go to StoryXpress dashboard.
2. Click on analytics.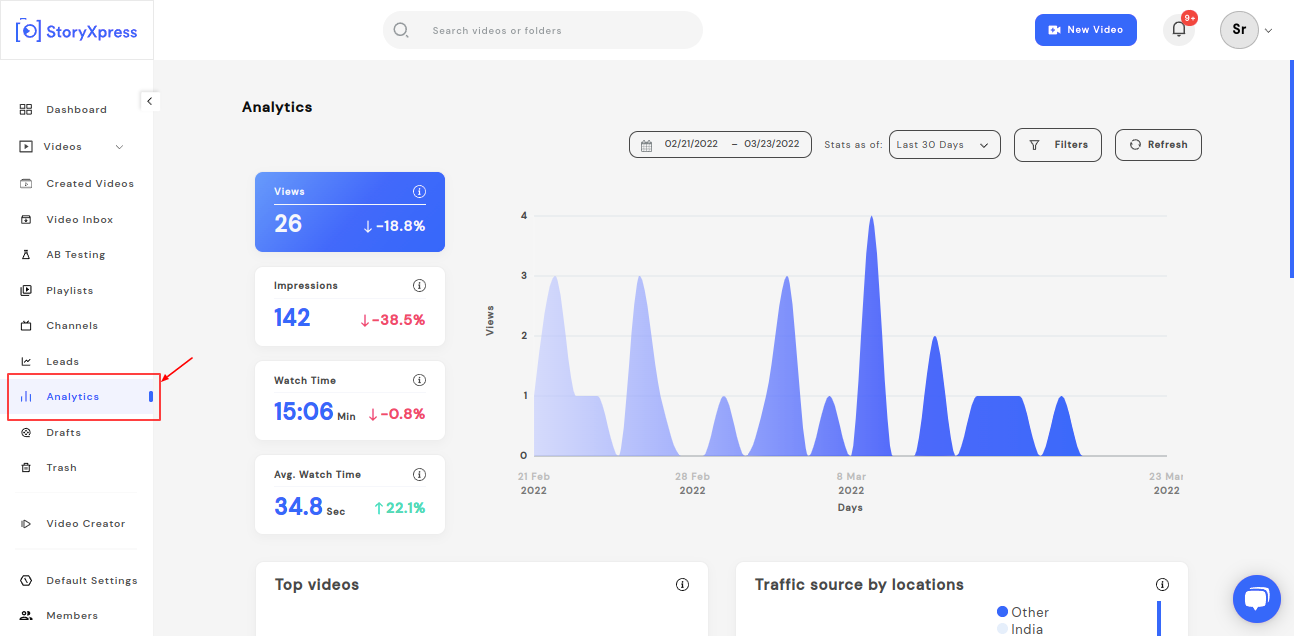
- Views: It is the Total number of Views on your Videos in the selected time period.
- Impressions: Impressions are the number of times a video has been viewed or displayed on a webpage.
- Watch-time: Total duration for which your videos have been watched for a given time period.
- Average Watch-time: Average duration for which all your videos have been watched in a given time period.
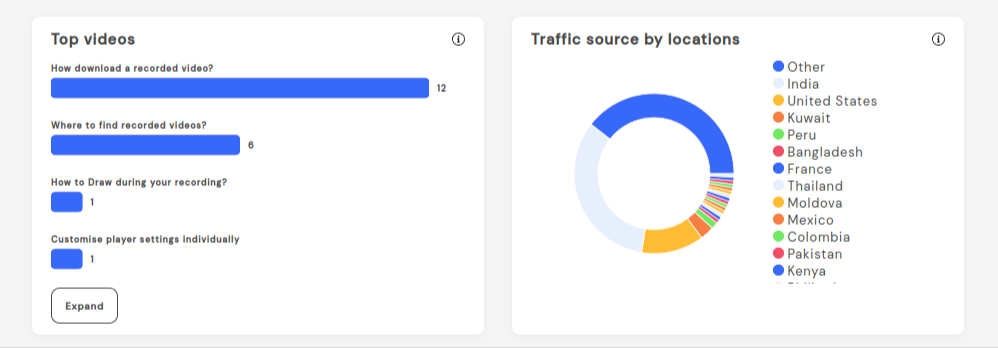
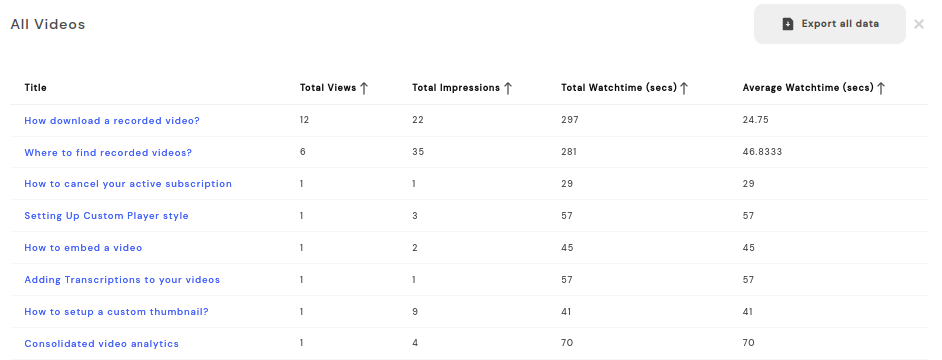
- Top Videos: Your highest performing videos amongst all the videos that you have shared. Expand the window and click the video for which you want to explore the individual data.
- Traffic source location: Gives you the list of countries of the viewers and the data is stored along with the views.
- Traffic Sources- Browsers: Gives you the list of various browsers on which your video is being viewed and data is stored along with the impression.
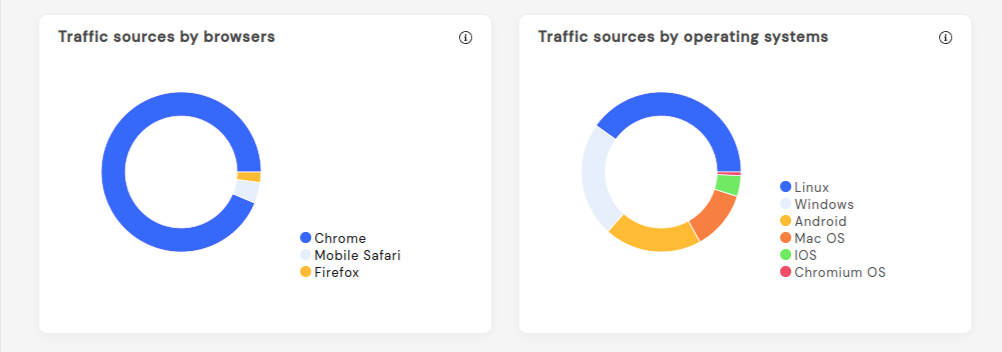
- Traffic Sources- Operating System: Gives you the list of various Operating systems on which your video is being viewed and data is stored along with the impression.
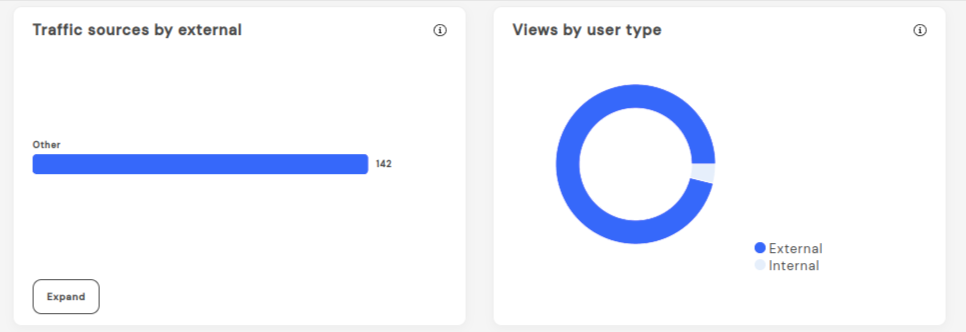
- Traffic Sources- External: Gives you the list of website sources from where the user landed to your video and data is stored along with the impression.
Please note: All the data is collected on the basis of location. Therefore, you can view the traffic data collected from various locations helping to understand the geographical engagement on your hosted videos.


 Free Screen Recorder for Chrome


